

Covid-19: some graphics and explanations
The purpose of this article is to go back over some notions related to the Covid-19 pandemic via some graphs in relation to the situation in Switzerland. The data begin on 27 February 2020 and end on 22 December 2020 and are available on the site of the Federal Office of Public Health (FOPH, Office fédéral de la santé publique (OFSP) [4]). It should be noted that the first Covid-19-related death recorded in Switzerland dates from 6 March 2020.
The first graph (Graphic 1) shows the distribution of covid-19 cases in Switzerland by age group. It shows a very low proportion of children carrying the virus, less than 1% for children aged 0 to 9 years and around 8% for children aged 10 to 19 years. Most infections occur between 20 and 60 years of age. About three quarters (67%) of Covid-19 cases in Switzerland are in these age groups. The last remaining quarter of the cases are in the 60 and more age group. But what about deaths? Graphic 2 provides a slightly clearer picture.

Graphic 1: Percentage of Covid-19 cases in Switzerland, sorted by age brackets
Graphic 2 shows the percentage of deaths due to Covid-19 in Switzerland by age group. People aged 80 and over account for almost three-quarters of deaths (72%), whereas they are responsible for only 7% of Covid-19 cases. This graph therefore shows that the elderly is indeed the most affected by this virus, with the 70-79 (20%), 60-69 (6%) and 50-59 (2%) years old being the most affected after the age of 80. While in Switzerland only one death has been reported for the 0-9 age group, none for the 10-29 age group, 7 for the 30-39 age group, 18 for the 40-49 age group and 99 for the 50-59 age group.
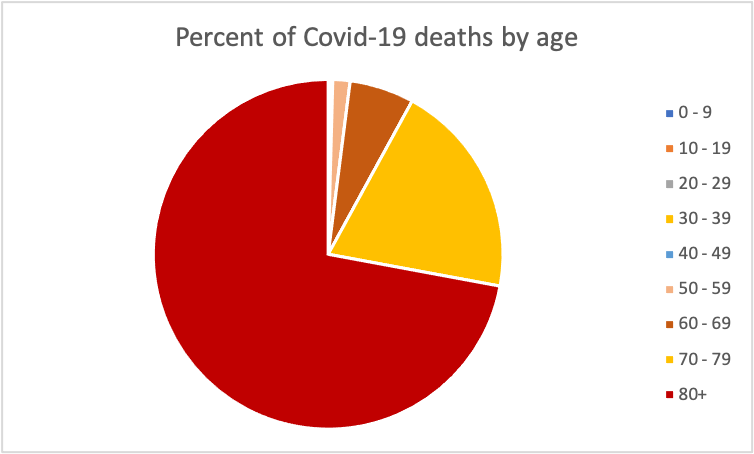
Graphic 2: Percentage of Covid-19 deaths in Switzerland, sorted by age brackets
These two graphics show that the notorious generation mix between parents and grandparents is indeed a threat to the lives of the elderly. The parents are, in general, more carriers of the virus but they are often healthy carriers. The grandparents, on the other hand, may become infected and have more problems. Switzerland has also taken steps in this direction in April 2020. Grandchildren can see their grandparents again, but parents must avoid contact with grandparents [1].
However, these findings are based on detected cases of Covid-19, because if no tests are carried out, it is almost impossible to know whether a person has Covid-19, even if they have symptoms. Furthermore, Switzerland has been criticized by many people, including Professor Didier Pittet, Swiss infectiologist and epidemiologist, for the number of tests carried out being far too low to contain the pandemic [2].
But what is the overall situation in Switzerland ? As it is difficult to rely on tests, the number of deaths makes it possible to have a quicker overview without complicated calculations. Graphic 3 shows the number of deaths due to Covid-19 in Switzerland from 27 February 2020 to 22 December 2020. It can be seen that the number of deaths is higher between November and December than in March. Semi-containment was announced on 13 March [3]. As the consequences on the economy have been significant, it can be assumed that the Confederation is under pressure and is reluctant to announce a second confinement. The number of deaths, among other indicators, would indicate that stricter measures should be put in place.

Graphic 3: Covid-19 deaths in Switzerland from February 2020 to December 2020
References:
[1] RTS info, grands-parents : https://www.rts.ch/info/suisse/11279151-les-grandsparents-peuvent-de-nouveau-etreindre-leurs-petitsenfants.html
[2] RTS info, test COvid-19: https://www.rts.ch/info/sciences-tech/11594432-la-suisse-effectue-peu-de-tests-covid19-en-comparaison-internationale.html
[3] Confinement en Suisse : https://www.admin.ch/gov/fr/accueil/documentation/communiques.msg-id-78437.html
[4] OFSP for the data :https://www.bag.admin.ch/bag/fr/home/krankheiten/ausbrueche-epidemien-pandemien/aktuelle-ausbrueche-epidemien/novel-cov/situation-schweiz-und-international.html


Great post. I used to be checking constantly this blog and I’m inspired!
Extremely useful info specifically the ultimate section :
) I take care of such info a lot. I used to be looking for this particular info
for a very long time. Thank you and best of luck.